Problem set 4
Submit this as a PDF on iCollege. You can use whatever you want to make your drawings, including Gravit Designer, Adobe Illustrator, Excel, PowerPoint, Microsoft Paint, or photographed/scanned pen and paper. I highly recommend using Desmos too!
Cite your sources and show your work.
1
Imagine a mild-mannered professor named Chidi Anagonye who is crippled with decision anxiety. He has to choose the best combination of pizza and frozen yogurt, but doesn’t know what to do! Here’s the information he has:
-
He has a budget of \$45 and must spend it all.
-
Slices of Hawaiian pizza cost \$3. Abbreviate this as
\(x\). -
Bowls of frozen yogurt cost \$1.50. Abbreviate this as
\(y\). -
The happiness Chidi gets from eating pizza and frozen yogurt can be modeled with this utility function:
$$ U(x, y) = x^2\ 0.25y $$
Part 1
Draw Chidi’s budget line (or his personal consumption possibility frontier) and figure out the equation for this line in \(y = mx + b\) form. What is the equation?
Part 2
Rearrange Chidi’s utility function using algebra so that it is in terms of \(y\) (i.e. so that it starts with \(y =\)). (Mega hint: you can check your algebra with WolframAlpha by typing solve u = x^2 * 0.25y for y). Plot his indifference curves for 10 utils, 100 utils, and 500 utils (using Desmos or any other graphing system).
What do these lines each represent?
Part 3
This utility function looks a little different from ones we’ve seen previously in class, since \(x\) and \(y\) no longer have the same numbers in front of them. What does this imply about Chidi’s preferences, and why? Choose 1, 2, 3, or 4 and explain in ≈30 words:
- There is a 1:1 ratio of utility. He can exchange one slice of pizza for one bowl of yogurt and maintain the same level of utility.
- He prefers yogurt to pizza. If the prices of both items were identical, he would consume twice as many yogurts.
- He prefers pizza to yogurt. If the prices of both items were identical, he would consume twice as much pizza.
- It is impossible to know; utility is imaginary.
Part 4
The marginal rate of substitution (or slope of Chidi’s indifference curve) is \(\frac{2y}{x}\). (I calculated this by going to WolframAlpha, typing derive u = x^2\ 0.25y, and finding the partial derivative with respect to \(x\) ($8xy$) and the partial derivative with respect to \(y\) ($4x^2$) and making them a ratio ($\frac{8xy}{4x^2}$). This simplifies down to \(\frac{2y}{x}\).) This does not take into account the prices he faces. The marginal rate of substitution can also be written as a ratio of prices, or \(\frac{\text{Price}_x}{\text{Price}_y}\).
Set the slope-only MRS and the ratio of prices equal to each other and solve for \(y\) (i.e. make the equation start with \(y =\)). This is the price-attuned marginal rate of substitution.
$$\frac{2y}{x} = \frac{\text{Price}_\text{Pizza}}{\text{Price}_\text{Yogurt}}$$
Finally, find where the price-attuned marginal rate of substitution matches the budget line by solving the system of equations. (Hint: your budget line will be \(y = \text{something}\ x ± \text{something}\), and your adjusted MRS will be something like \(y = \text{something else}\ x ± \text{something else}\). Take the \(y\) of the adjusted MRS, plug it into the \(y\) of the budget line, and use algebra to figure out what \(x\) is ($\text{something else}\ x ± \text{something else} = \text{something}\ x ± \text{something})$. Then take that \(x\), plug it in as \(x\) into one of the equations, and solve for \(y\).)
How many slices of pizza and bowls of frozen yogurt will Chidi consume given his budget of $45? How many utils will that level of consumption provide him with? Plot the budget line and tangential indifference curve.
2
Leslie Knope, deputy director of the parks department, once mused “Why would anybody ever eat anything besides breakfast food?” Consistent with this belief, she consumes waffles whenever possible.
Here are 5 different sets of budget lines and indifference curves. In each, point A shows original consumption, point B shows new consumption after a change in budget, and point C shows the in-between level of hypothetical consumption. The red line shows the original budget line; the blue line shows the budget line after a change in prices.
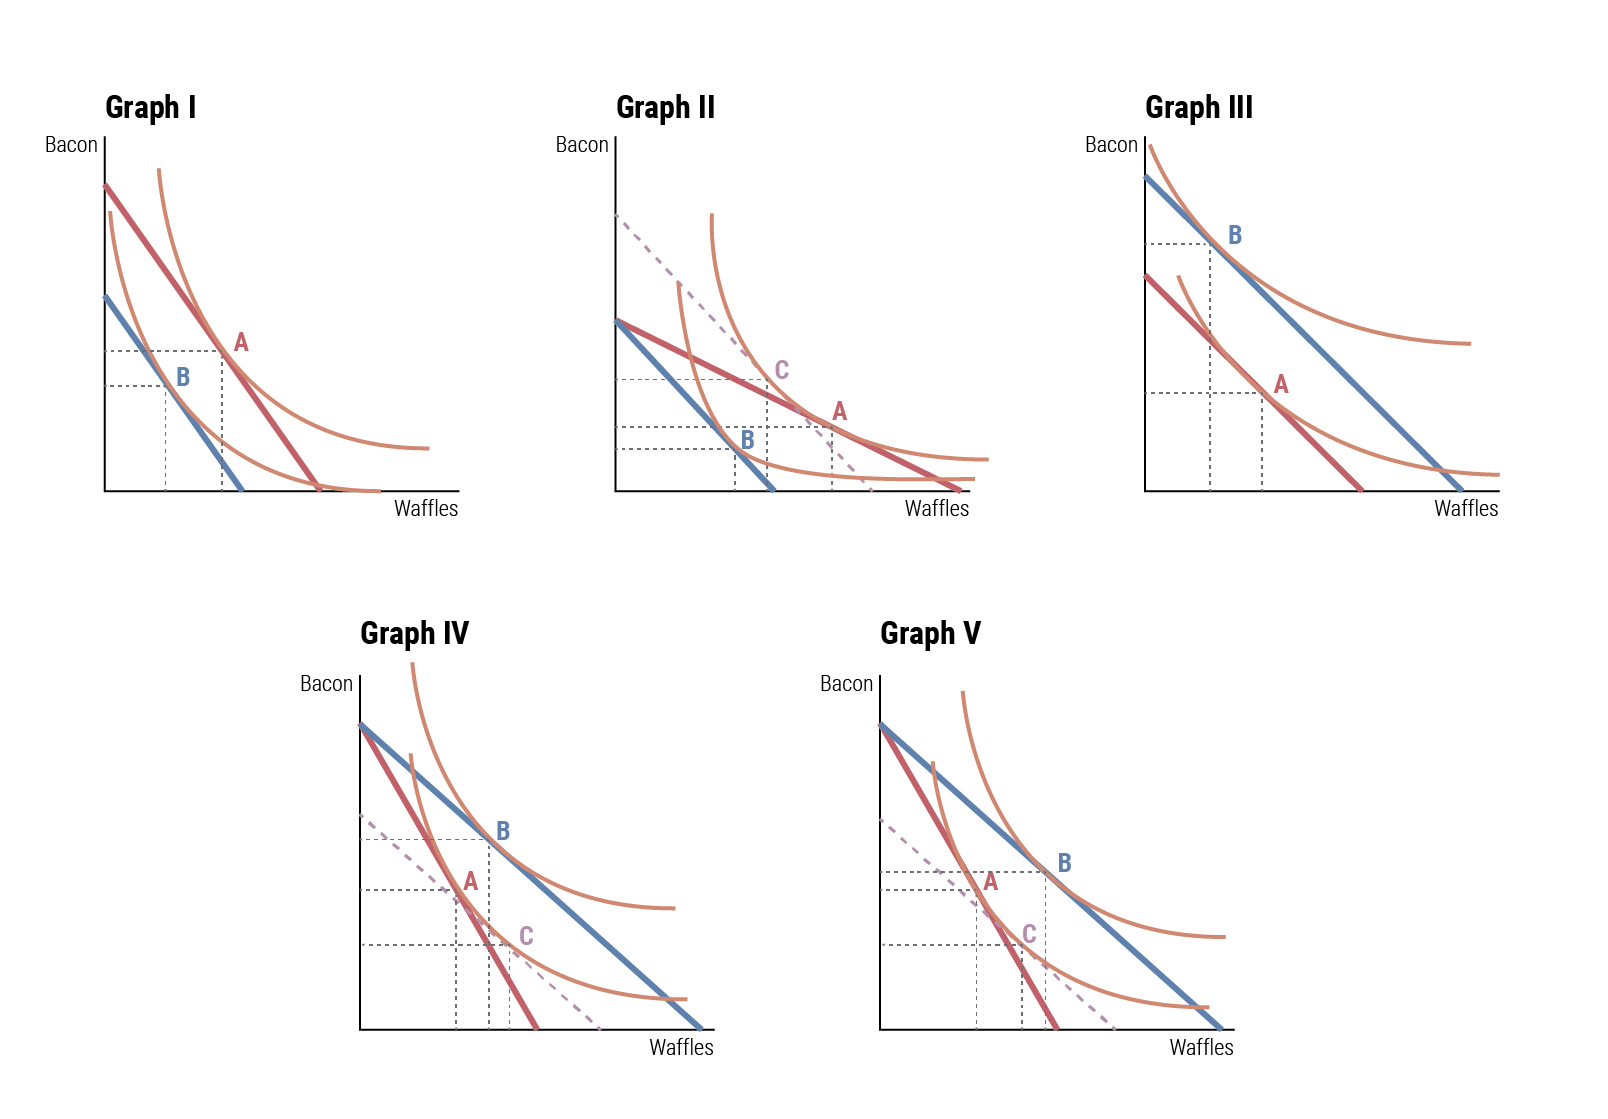
For each of these questions, select the appropriate answer(s) and explain why in ≈20 words.
-
Of these graphs, which one(s) show an increase in the price of waffles? (multiple answers allowed, but multiple answers aren’t necessarily correct)
- I
- II
- III
- IV
- V
-
Of these graphs, which one(s) show an increase in income? (multiple answers allowed, but multiple answers aren’t necessarily correct)
- I
- II
- III
- IV
- V
-
Which of these graphs show waffles as a normal good? (multiple answers allowed, but multiple answers aren’t necessarily correct)
- I
- II
- III
- IV
- V
-
Which of these graphs show waffles as an inferior good? (multiple answers allowed, but multiple answers aren’t necessarily correct)
- I
- II
- III
- IV
- V
3
(This is similar to the Harvest Box/WIC example we talked about in class)
Suppose residents of a rural community in a developing nation spend all of their income on two goods: clothing and food. The price of clothing is 10 dinar per package and the price of food is 5 dinar per kilogram.
Consider a family with income of 200 dinar per week. In the absence of any government program, the family would consume 30 kg of food.
- Draw the family’s budget line, labeling all axes and all points whose value you know. Mark the family’s equilibrium consumption point as
\(A\). - On the same graph, draw a new budget line for a program that provides each family with 5 free packages of clothing.
- In a new graph, draw the family’s original budget line. Show the effect of an increase in the price of clothing to 20 dinar per package, assuming that clothing is a normal good. Show the income and substitution effects. Use actual numbers. (There are no correct numbers, though.)
- What do the income and substitution effects mean in this situation?
4
In each of these situations, explain who is the principal, who is the agent, and what aspects of their interaction are of interest to each and are not covered by a complete contract.
- A company hires a security guard to protect its premises at night.
- A charity wants to commission research to find out as much as possible about a new virus.
For each of these situations, predict a few possible consequences if the contract is poorly defined. Answer both in ≈100 words.
5
The British Road Safety Act of 1967 created a mandatory penalty for drunken driving—those convicted of a DUI lost their licenses for one year. Several insurance companies began offering policies that insured against loss of license. Policyholders were guaranteed a chauffeur-driven vehicle if they were convicted of DUI.
It is reasonable to predict that people who chose to buy this insurance would subsequently have a higher rate of DUI arrests than those who did not buy the insurance.
- Justify this prediction using adverse selection. What is adverse selection and how does it apply here? Discuss in ≈50 words
- Justify this prediction using moral hazard. What is moral hazard and how does it apply here? Discuss in ≈50 words
6
Think of two public or nonprofit sector jobs. In each case, describe why the employment contract is necessarily incomplete. What important parts of the person’s job—things that the employer would like to see the employee do or not do—cannot be covered in a contract, or if they are, cannot be enforced? Discuss in ≈75 words.
7
In an effort to encourage parents to read to their children, suppose that the state created “Georgia Reads,” a new program that subsidizes the purchase of children’s books. Under this proposal, every time a children’s book is purchased from a store in Georgia, the store would charge just half of the retail price and would be reimbursed directly by the state for the other half. The market price for a children’s book is $10 and books are a normal good.
- For a family with an income of $1,000 per month, draw budget lines before and after Georgia Reads, labeling all known curves, axes, and points. (Hint: put “books” on the x-axis and “all other goods” (or “AOG”) on the y-axis.)
- Show the income and substitution effects. Use actual numbers. Note that your numbers will differ, since everyone’s indifference curves are different.
- What do the income and substitution effects mean in this situation?
8
(This question is tricky, but it’s very similar to the Harvest Box example that we will talk about in class. If you find yourself completely stuck, don’t worry—this is a stretch/extra-credit question.)
Legislators are frequently frustrated by a common reaction to new policy. Lawmakers pass a new bill that provides grants to local jurisdictions for specific purposes, but most of the money never seems to be spent for what they had hoped it would. This is rarely because local officials break the law—most are careful not to violate the letter of the law.
For instance, imagine that Georgia wanted to increase the amount of money local school districts spend on textbooks. Legislators enact the Textbook Act of 2020, which provides grants to local districts equal to $14 per student (so a district with 1,000 students would get $14,000). This new money can only be spent on textbooks. At the end of the year, state officials discover that the average amount spent on textbooks in the state only increased by $3.
-
Assuming that a school district can have preferences in their consumption of textbooks and other goods. Graphically illustrate how this underspending might have happened using budget lines and indifference curves.
Hint: place “textbooks” on the x-axis, “all other goods (AOG)” on the y-axis, and use dollars as the units for both (since you don’t know the price of textbooks).
-
What are the income and substitution effects of the Textbook Act of 2020?